Getting started: Simple regression with Ariadne
This tutorial shows how to use the Ariadne library for Gaussian process regression.
As a first step, we need to get Ariadne.dll from NuGet.
Then we can load the Ariadne library inside F#.
1: 2: 3: |
#r "Ariadne.dll" open Ariadne.GaussianProcess open Ariadne.Kernels |
We will introduce Ariadne through a practical example. Consider a time series dataset with missing values. For example, we might be interested in income distribution and inequality in Russia over the past 30 years. We can download available data from the World Bank using FSharp.Data library. We will use FSharp.Charting to display the data. We will also need a reference to Math.NET Numerics.
1: 2: 3: 4: 5: 6: 7: 8: 9: 10: 11: 12: 13: 14: |
#r "FSharp.Data.dll" #r "FSharp.Charting.dll" #r "MathNet.Numerics.dll" open FSharp.Data open FSharp.Charting let wb = WorldBankData.GetDataContext() let rawData = wb.Countries.``Russian Federation``.Indicators.``GINI index`` |> Seq.toArray Chart.Point(rawData) |
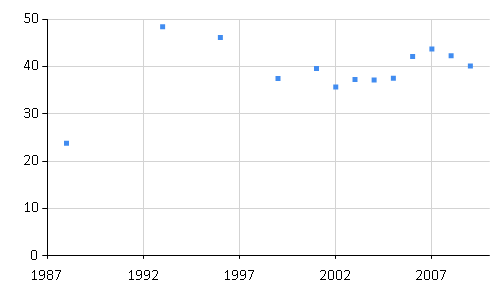
The snippet downloads raw data from the World Bank on the Gini index, which measures income inequality. We can see that the time series contains missing data, for example there are no values between years 1988 and 1993.
[|(1988, 23.8); (1993, 48.38); (1996, 46.11); (1999, 37.48); (2001, 39.6);
  (2002, 35.7); (2003, 37.26); (2004, 37.14); (2005, 37.51); (2006, 42.13);
  (2007, 43.71); (2008, 42.27); (2009, 40.11)|]
We can use Gaussian process regression model to interpolate the observed data and estimate Gini index in the years when it was not measured. As a first step, we need to prepare the downloaded data.
Data preprocessing
1: 2: 3: 4: 5: 6: 7: 8: 9: 10: 11: |
let years, values = Array.unzip rawData // inputs let xs = years |> Array.map float // centred outputs let ys = let avg = Array.average values values |> Array.map (fun y -> y - avg) // Gaussian process data let data = [{Locations = xs; Observations = ys}] |
We formulated the data in the form expected by the Gaussian process library. General data
for Gaussian process consist of a sequence of series measurements.
In our case, we have only one time series.
Each series of measurements contains locations of each measurement (time points in our example)
and observed values for each location (Gini index values).
The Locations and Observations arrays should have equal length.
In general applications, locations and observations are not restricted to time series. For example locations can represent geographical coordinates and observations might record rainfall at each location.
Covariance function
Covariance functions (also called kernels) are the key ingredient in using Gaussian processes. They encode all assumptions about the form of function that we are modelling. In general, covariance represents some form of distance or similarity. Consider two input points (locations) \(x_i\) and \(x_j\) with corresponding observed values \(y_i\) and \(y_j\). If the inputs \(x_i\) and \(x_j\) are close to each other, we generally expect that \(y_i\) and \(y_j\) will be close as well. This measure of similarity is embedded in the covariance function.
Ariadne currently contains implementation of the most commonly used covariance function, the squared exponential kernel. For more information see Covariance functions. The following snippet creates the squared exponential covariance function.
1: 2: 3: 4: 5: 6: |
// hyperparameters let lengthscale = 3.0 let signalVariance = 15.0 let noiseVariance = 1.0 let sqExp = SquaredExp.SquaredExp(lengthscale, signalVariance, noiseVariance) |
The hyperparameters regulate specific behaviour of the squared exponential kernel. For details see the Covariance functions section. Details on how to select values for hyperparameters are in the Optimization section of this website.
Gaussian process regression
There are two ways how to create a Gaussian process model. The first one uses directly the squared exponential kernel that we created in the previous snippet. The second option is to create Gaussian process model 'from scratch' by specifying a covariance function, prior mean and optional noise variance. The library currently implements only zero prior mean.
1: 2: 3: 4: 5: 6: |
// First option how to create a Gaussian process model let gp = sqExp.GaussianProcess() // Second option how to create a Gaussian process model let covFun = sqExp.Kernel let gp1 = GaussianProcess(covFun, ZeroMean, Some noiseVariance) |
Now that we created a Gaussian process, we can use it to compute regression function. Please note that current implementation of inference in Gaussian processes is exact and therefore requires \(\mathcal{O} (N^3)\) time, where \(N\) is the number of data points.
We can compute log likelihood to see how well the Gaussian process model fits our World bank data. The log likelihood may be used to compare different models.
1:
|
let loglik = gp.LogLikelihood data |
-45.09576717
We can also use Gaussian process to estimate values of the Gini index in
years where there are no data. The Predict function gives us the mean
estimate for each time location and variance of the estimate.
1: 2: 3: 4: 5: 6: 7: |
let allYears = [| 1985.0 .. 2015.0 |] let predictValues, predictVariance = allYears |> gp.Predict data Array.zip3 allYears predictValues predictVariance |> Array.iteri (fun i (year, gini, var) -> if i < 5 then printfn "%.0f : %.3f (+/- %.3f)" year gini (sqrt var)) |
We can print the predicted values for each year together with their standard deviations.
1985 : -10.091 (+/- 3.250)
1986 : -13.017 (+/- 2.585)
1987 : -14.740 (+/- 1.808)
1988 : -14.381 (+/- 1.390)
1989 : -11.567 (+/- 1.655)
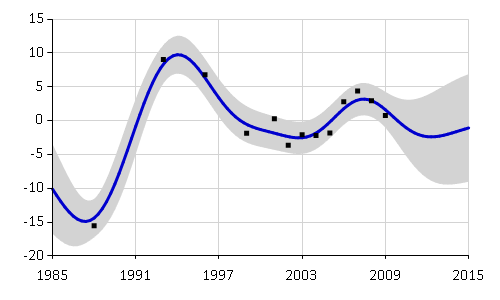
To display the full posterior regression function, we can also automatically
plot the Gaussian process using F# Charting.
There are two functions for Gaussian process charts included in the library.
There is a basic plot function, which uses Gaussian process to interpolate observed values.
The plotRange function extrapolates the Gaussian process over a specified
range of values. We can use it to draw a graph of estimated Gini index values between years
1995 to 2015.
1:
|
gp |> plotRange (1985.0, 2015.0) data |
Continue to Covariance functions to find out more about the squared exponential covariance. Optimization provides an overview of how to fit hyperparameters of covariance functions (lengthscale, signal variance etc).
from Ariadne
from Ariadne
Full name: Tutorial.wb
static member GetDataContext : unit -> WorldBankDataService
nested type ServiceTypes
Full name: FSharp.Data.WorldBankData
<summary>Typed representation of WorldBank data. See http://www.worldbank.org for terms and conditions.</summary>
Full name: Tutorial.rawData
from Microsoft.FSharp.Collections
Full name: Microsoft.FSharp.Collections.Seq.toArray
static member Area : data:seq<#value> * ?Name:string * ?Title:string * ?Labels:#seq<string> * ?Color:Color * ?XTitle:string * ?YTitle:string -> GenericChart
static member Area : data:seq<#key * #value> * ?Name:string * ?Title:string * ?Labels:#seq<string> * ?Color:Color * ?XTitle:string * ?YTitle:string -> GenericChart
static member Bar : data:seq<#value> * ?Name:string * ?Title:string * ?Labels:#seq<string> * ?Color:Color * ?XTitle:string * ?YTitle:string -> GenericChart
static member Bar : data:seq<#key * #value> * ?Name:string * ?Title:string * ?Labels:#seq<string> * ?Color:Color * ?XTitle:string * ?YTitle:string -> GenericChart
static member BoxPlotFromData : data:seq<#key * #seq<'a2>> * ?Name:string * ?Title:string * ?Color:Color * ?XTitle:string * ?YTitle:string * ?Percentile:int * ?ShowAverage:bool * ?ShowMedian:bool * ?ShowUnusualValues:bool * ?WhiskerPercentile:int -> GenericChart (requires 'a2 :> value)
static member BoxPlotFromStatistics : data:seq<#key * #value * #value * #value * #value * #value * #value> * ?Name:string * ?Title:string * ?Labels:#seq<string> * ?Color:Color * ?XTitle:string * ?YTitle:string * ?Percentile:int * ?ShowAverage:bool * ?ShowMedian:bool * ?ShowUnusualValues:bool * ?WhiskerPercentile:int -> GenericChart
static member Bubble : data:seq<#value * #value> * ?Name:string * ?Title:string * ?Labels:#seq<string> * ?Color:Color * ?XTitle:string * ?YTitle:string * ?BubbleMaxSize:int * ?BubbleMinSize:int * ?BubbleScaleMax:float * ?BubbleScaleMin:float * ?UseSizeForLabel:bool -> GenericChart
static member Bubble : data:seq<#key * #value * #value> * ?Name:string * ?Title:string * ?Labels:#seq<string> * ?Color:Color * ?XTitle:string * ?YTitle:string * ?BubbleMaxSize:int * ?BubbleMinSize:int * ?BubbleScaleMax:float * ?BubbleScaleMin:float * ?UseSizeForLabel:bool -> GenericChart
static member Candlestick : data:seq<#value * #value * #value * #value> * ?Name:string * ?Title:string * ?Labels:#seq<string> * ?Color:Color * ?XTitle:string * ?YTitle:string -> CandlestickChart
static member Candlestick : data:seq<#key * #value * #value * #value * #value> * ?Name:string * ?Title:string * ?Labels:#seq<string> * ?Color:Color * ?XTitle:string * ?YTitle:string -> CandlestickChart
...
Full name: FSharp.Charting.Chart
static member Chart.Point : data:seq<#key * #value> * ?Name:string * ?Title:string * ?Labels:#seq<string> * ?Color:System.Drawing.Color * ?XTitle:string * ?YTitle:string * ?MarkerColor:System.Drawing.Color * ?MarkerSize:int -> ChartTypes.GenericChart
Full name: Tutorial.years
Full name: Tutorial.values
from Microsoft.FSharp.Collections
Full name: Microsoft.FSharp.Collections.Array.unzip
Full name: Tutorial.xs
Full name: Microsoft.FSharp.Collections.Array.map
val float : value:'T -> float (requires member op_Explicit)
Full name: Microsoft.FSharp.Core.Operators.float
--------------------
type float = System.Double
Full name: Microsoft.FSharp.Core.float
--------------------
type float<'Measure> = float
Full name: Microsoft.FSharp.Core.float<_>
Full name: Tutorial.ys
Full name: Microsoft.FSharp.Collections.Array.average
Full name: Tutorial.data
Full name: Tutorial.lengthscale
Full name: Tutorial.signalVariance
Full name: Tutorial.noiseVariance
Full name: Tutorial.sqExp
from Ariadne.Kernels
type SquaredExp =
new : lengthscale:float * signalVariance:float * noiseVariance:float -> SquaredExp
member GaussianProcess : unit -> GaussianProcess<float>
member Kernel : x1:float * x2:float -> float
override ToString : unit -> string
member Lengthscale : float
member NoiseVariance : float
member Parameters : float []
member SignalVariance : float
Full name: Ariadne.Kernels.SquaredExp.SquaredExp
--------------------
new : lengthscale:float * signalVariance:float * noiseVariance:float -> SquaredExp.SquaredExp
Full name: Tutorial.gp
Full name: Tutorial.covFun
Full name: Tutorial.gp1
type GaussianProcess<'T> =
new : covariance:Kernel<'T> * noiseVariance:float option -> GaussianProcess<'T>
new : covariance:Kernel<'T> * meanFunction:MeanFunction * noiseVariance:float option -> GaussianProcess<'T>
member LogLikelihood : data:seq<Observation<'T>> -> float
member PosteriorGaussianProcess : data:seq<Observation<'T>> -> newLocations:'T [] -> Vector<float> * Matrix<float>
member Predict : data:seq<Observation<'T>> -> newLocations:'T [] -> float [] * float []
member PredictiveLogLikelihood : data:seq<Observation<'T>> -> x:Observation<'T> -> float
member Covariance : Kernel<'T>
member Mean : MeanFunction
member NoiseVariance : float option
Full name: Ariadne.GaussianProcess.GaussianProcess<_>
--------------------
new : covariance:Kernel<'T> * noiseVariance:float option -> GaussianProcess<'T>
new : covariance:Kernel<'T> * meanFunction:MeanFunction * noiseVariance:float option -> GaussianProcess<'T>
Full name: Tutorial.loglik
Full name: Tutorial.allYears
Full name: Tutorial.predictValues
Full name: Tutorial.predictVariance
Full name: Microsoft.FSharp.Collections.Array.zip3
Full name: Microsoft.FSharp.Collections.Array.iteri
Full name: Microsoft.FSharp.Core.ExtraTopLevelOperators.printfn
Full name: Microsoft.FSharp.Core.Operators.sqrt
Full name: Ariadne.GaussianProcess.plotRange
